该篇内容为原博客博文,原上传于2022年10月29日。
前置知识 自动内存管理 说到程序的内存管理,C/C++开发人员具有绝对的权利。通过malloc()和new,他们可以极其奔放地分配内存,自由掌控对象的“所有权”。然而能力越大责任也越大,伴随着操控内存的快感之后而来的则是维护内存的无尽痛苦。编译器不能发现潜在的内存问题,必须由开发者提前避免。喜闻乐见的问题包括但不限于:
1
2
3
4
5
6
7
8
9
10
11
12
13
14
15
16
17
18
19
20
21
22
23
24
25
26
27
28
29
30
31
32
33
34
35
36
37
38
39
40
41
42
43
44
45
46
47
48
49
50
51
52
53
sws = sws_getContext ( in_width, in_height, AV_PIX_FMT_YUV420P, out_width, out_height, AV_PIX_FMT_YUV420P, SWS_FAST_BILINEAR, nullptr , nullptr , nullptr ); if (!sws) { av_log (nullptr , AV_LOG_INFO, "Cannot create sws context.\n" ); } outputFile = fopen (outputPath, "wb" ); if (!outputFile) { av_log (nullptr , AV_LOG_ERROR, "Failed to open output file!\n" ); } ... if (!x264Param) delete x264Param;x264Param = new x264_param_t ; int ret = x264_param_default_preset (x264Param, "fast" , "zerolatency" );if (ret < 0 ) { av_log (nullptr , AV_LOG_ERROR, "Failed to set preset parameter!\n" ); } ... ret = x264_param_apply_profile (x264Param, x264_profile_names[1 ]); if (ret < 0 ) { av_log (nullptr , AV_LOG_ERROR, "Failed to apply main profile!\n" ); } encoder = x264_encoder_open (x264Param); if (!encoder) { av_log (nullptr , AV_LOG_ERROR, "Failed to open x264 encoder!\n" ); } int header_size = x264_encoder_headers (encoder, &nals, &nalCount);if (header_size < 0 ) { av_log (nullptr , AV_LOG_ERROR, "Error when calling x264_encoder_headers()!\n" ); } if (!fwrite (nals[0 ].p_payload, sizeof (uint8_t ), header_size, outputFile)) { av_log (nullptr , AV_LOG_ERROR, "Failed to write header!\n" ); }
1 2 3 4 5 6 7 8 9 10 11 12 13 14 15 16 X264Encoder::~X264Encoder () { if (encoder) { x264_picture_clean (&inFrame); x264_encoder_close (encoder); encoder = nullptr ; } if (outputFile) { fclose (outputFile); outputFile = nullptr ; } if (sws) { sws_freeContext (sws); sws = nullptr ; } delete mbQp; }
其它:野指针、越界、…(虽然这些多半是程序员自己粗心大意)
于是有人想到,如果能够自动管理对象的生命周期,写代码的时候可能就可以少考虑一些麻烦事,少写一些模版化的代码了。这就是自动内存管理的诞生。jvm 正具有自动内存管理的能力,对于 jvm 系语言的程序员来说,在虚拟机自动内存管理机制的帮助下,不再需要操心为每一个new操作写配对的delete/free,也因此大大减少了内存泄漏和内存溢出的可能。虽然将内存控制的权利交给 jvm ,可以为开发者省去不少麻烦,但也正因如此,一旦真的出现了内存相关问题,如果不了解 jvm 的内存结构和管理策略,排查错误也将无从下手。
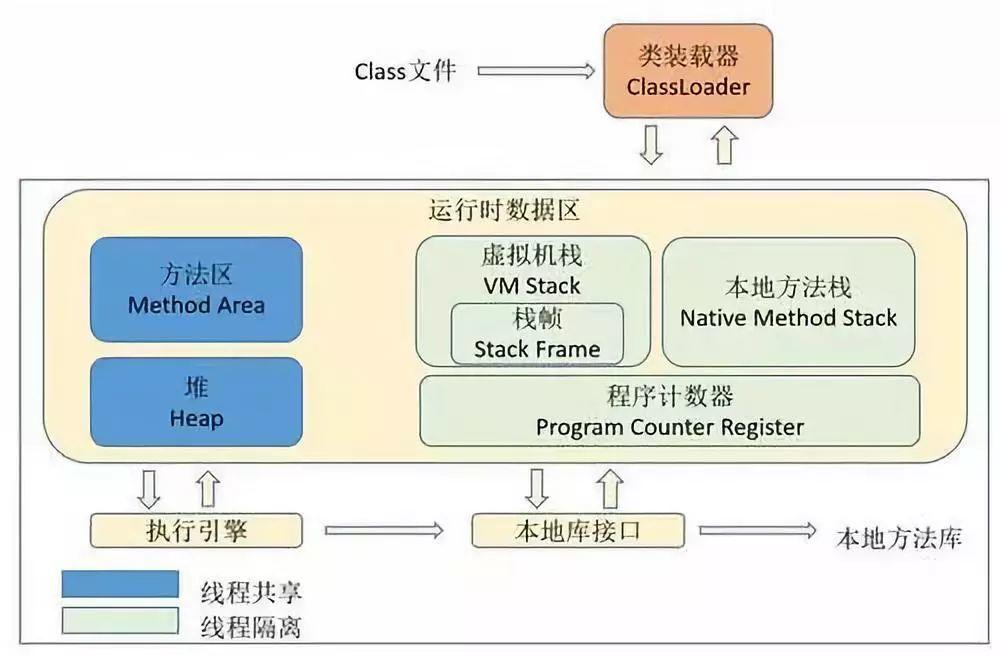
jvm内存结构
对象的自动清理——GC 引用计数算法 给对象中添加一个引用计数器,每当有一个地方引用它时,计数器值就加1;当引用失效时,计数器就减1。回收计数器值为0的对象内存。优点 实现简单,判定效率高。缺点 不能解决循环引用对象的回收。
可达性分析算法 以一系列被称为 GC Roots 的对象为根,从这些根节点开始向下搜索,搜索途径的路径称为引用链。当一个对象到 GC Roots 没有任何引用链(图论中的不可达),则证明该对象不可用,可以被回收。
可作为 GC Roots 的对象:
虚拟机栈中引用的对象
方法区中类静态属性引用的对象
方法区中常量引用的对象
本地方法栈中 JNI 引用的对象
.hprof文件 .hprof 是 jvm 的堆内存快照文件,可用于分析内存泄漏等异常问题。对其文件结构感兴趣的同学可以阅读协议文档 。
四种引用 强引用 强引用就是在代码中普遍存在的,类似val obj = Any()(new in java )这类的引用。只要强引用仍存在,GC 就永远不会回收被引用的对象。
软引用 用以描述尚有用但非必需的对象。对于软引用关联的对象,在系统即将发生 OOM 之前,会被 GC 列入回收范围之中进行第二次回收,如果这次回收后依然没有足够内存,则抛出 OOM 异常。
1 val obj = SoftReference(Any())
弱引用 也用以描述非必需对象,但强度比软引用更弱一些。被弱引用关联的对象只能生存到下一次 GC 发生之前。当 GC 工作时,无论当前内存是否足够,都会回收掉只被弱引用关联的对象(即 LeakCanary 中所指的弱可达 )。
1 val obj = WeakReference(Any())
虚引用 也称为幽灵引用或幻影引用,是最弱的一种引用关系。一个对象是否有虚引用的存在,完全不会对其生存时间构成影响,也无法通过虚引用获取对象实例。为一个对象设置虚引用的唯一目的就是能在这个对象被 GC 回收时收到一个系统通知。
1 val obj = PhantomReference(Any())
引用队列 当注册的引用型对象(软引用、弱引用、虚引用)在 GC 检测到所引用的对象可达性发生改变时,会将这个引用型的对象添加到引用队列中。引用队列实际上只是持有着已经不再引用堆中的要被清除的对象的引用型对象,并不能使对象再次存活下去,其用处只是为了提醒程序员非强引用型变量所引用的对象已经具有不可达性,即这个对象已经从堆中拿不到了。
LeakCanary LeakCanary 是 Android 开源社区巨头 Square 公司出品的 Android app 内存泄漏检测工具。
2.x版本Logo: 一只寄了的金丝雀
自2.0-alpha-1版本以后,LeakCanary 经由纯 kotlin 重写,并且更新了许多 API 沿用至今,故此处只简要介绍 LeakCanary2 的使用,以及基于 LeakCanary2 源码分析其原理。
基本使用
引入该库依赖。
1
2
3
4
5
6
7
val leakCanaryVersion = "2.9.1" dependencies { ... debugImplementation("com.squareup.leakcanary:leakcanary-android:$leakCanaryVersion " ) ... }
模拟一个典型的内存泄漏场景
1
2
3
4
5
6
7
8
9
10
11
12
13
14
15
16
17
18
19
20
21
22
23
24
25
26
27
28
29
30
31
32
33
34
35
36
37
38
39
40
41
42
43
44
45
46
47
48
49
50
51
52
53
54
55
56
57
58
59
60
61
62
63
@DelicateCoroutinesApi class MainActivity : ComponentActivity () { private val handler: Handler = object : Handler(Looper.getMainLooper()) { override fun handleMessage (msg: Message ) super .handleMessage(msg) Log.d(TAG, "handleMessage: handler msg: ${msg.what} " ) } } override fun onCreate (savedInstanceState: Bundle ?) super .onCreate(savedInstanceState) setContent { val context = LocalContext.current AVPlayerTheme { Surface( modifier = Modifier.fillMaxSize(), color = MaterialTheme.colorScheme.background ) { Column( modifier = Modifier.fillMaxSize(), horizontalAlignment = Alignment.CenterHorizontally, verticalArrangement = Arrangement.SpaceEvenly ) { Button( onClick = { GlobalScope.launch(Dispatchers.IO) { while (true ) { handler.sendEmptyMessage(1 ) delay(1000 ) } } Toast.makeText(context, "start job." , Toast.LENGTH_SHORT).show() }, ) { Text(text = "start job" ) } Button( onClick = { startActivity(Intent(context, SecondActivity::class .java)) finish() } ) { Text(text = "start activity" ) } } } } } } override fun onDestroy () super .onDestroy() Log.d(TAG, "onDestroy: called" ) } companion object { private const val TAG = "MainActivity" } }
这里我们以匿名内部类的方式在MainActivity中创建了一个Handler,将主线程的looper传给该handler,并创建了一个协程让handler不断向主线程发送空消息。点击第一个按钮将启动该协程,第二个按钮将跳转至另一个activity并立即销毁当前activity。
分析不难得知,虽然销毁了activity,但协程中的线程依然活跃并作为GC Root 对象。而该线程又持有handler实例,handler作为内部类又隐式持有外部mainActivity实例,故存在以下引用链使得mainActivity可达(随便找了个在线画图网页,请无视掉水印):
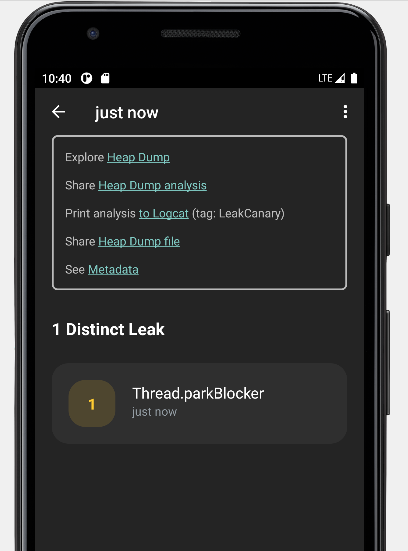
启动应用,不一会儿便可以看到LeakCanary弹出一则通知,表示探测到了内存泄漏:
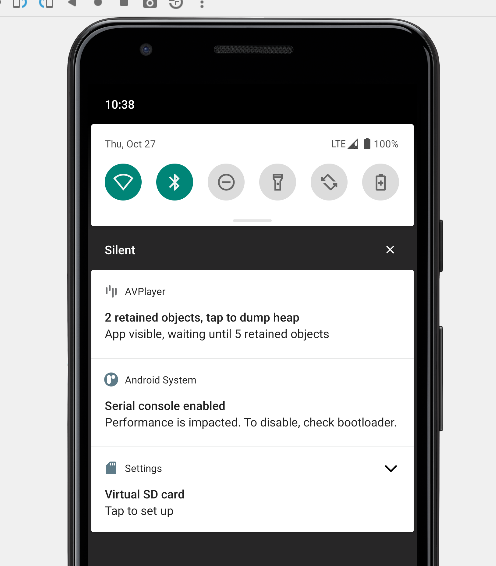
点击该通知,将开始导出并分析app运行时jvm堆的信息。当提示完成时,再次点击通知,将进入LeakCanary提供的客户端:
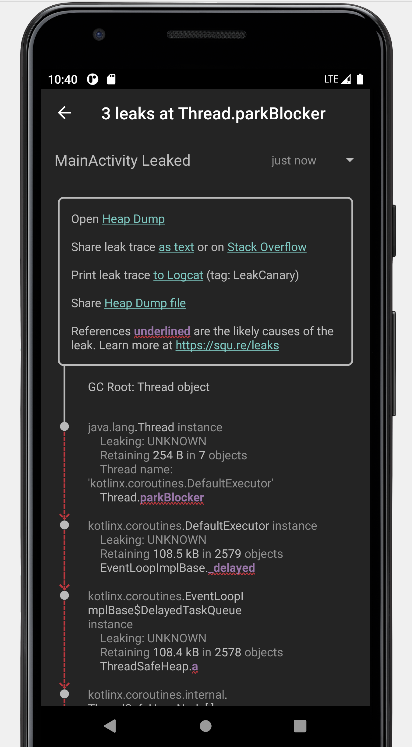
点击这个刚感知到的内存泄漏条目,堆的信息将以可视化的形式呈现:
或者我们也可以从日志中获取引用链的信息,示例输出的日志如下:
1
2
3
4
5
6
7
8
9
10
11
12
13
14
15
16
17
18
19
20
21
22
23
24
25
26
27
28
29
30
31
32
33
34
35
36
37
38
39
40
41
42
43
44
45
46
47
48
49
50
51
52
53
54
55
56
57
58
59
60
61
62
63
64
65
66
67
68
69
70
71
72
73
74
75
76
77
78
79
80
81
82
83
84
85
86
87
88
89
90
91
92
93
94
95
96
97
98
99
100
101
==================================== HEAP ANALYSIS RESULT ==================================== 1 APPLICATION LEAKS References underlined with "~~~" are likely causes. Learn more at https://squ.re/leaks. 108144 bytes retained by leaking objects Signature: 2dbd12c5ad0a3810a8158c3cd35a69dcb07f496d ┬─── │ GC Root: Thread object │ ├─ java.lang.Thread instance │ Leaking: UNKNOWN │ Retaining 254 B in 7 objects │ Thread name: 'kotlinx.coroutines.DefaultExecutor' │ ↓ Thread.parkBlocker │ ~~~~~~~~~~~ ├─ kotlinx.coroutines.DefaultExecutor instance │ Leaking: UNKNOWN │ Retaining 108.5 kB in 2579 objects │ ↓ EventLoopImplBase._delayed │ ~~~~~~~~ ├─ kotlinx.coroutines.EventLoopImplBase$DelayedTaskQueue instance │ Leaking: UNKNOWN │ Retaining 108.4 kB in 2578 objects │ ↓ ThreadSafeHeap.a │ ~ ├─ kotlinx.coroutines.internal.ThreadSafeHeapNode[] array │ Leaking: UNKNOWN │ Retaining 108.4 kB in 2577 objects │ ↓ ThreadSafeHeapNode[0] │ ~~~ ├─ kotlinx.coroutines.EventLoopImplBase$DelayedResumeTask instance │ Leaking: UNKNOWN │ Retaining 108.4 kB in 2576 objects │ ↓ EventLoopImplBase$DelayedResumeTask.cont │ ~~~~ ├─ kotlinx.coroutines.CancellableContinuationImpl instance │ Leaking: UNKNOWN │ Retaining 108.3 kB in 2575 objects │ ↓ CancellableContinuationImpl.delegate │ ~~~~~~~~ ├─ kotlinx.coroutines.internal.DispatchedContinuation instance │ Leaking: UNKNOWN │ Retaining 108.2 kB in 2570 objects │ ↓ DispatchedContinuation.continuation │ ~~~~~~~~~~~~ ├─ com.eynnzerr.avplayer.MainActivity$onCreate$1$1$1$1$1$1 instance │ Leaking: UNKNOWN │ Retaining 108.2 kB in 2569 objects │ Anonymous subclass of kotlin.coroutines.jvm.internal.SuspendLambda │ this$0 instance of com.eynnzerr.avplayer.MainActivity with mDestroyed = true │ ↓ MainActivity$onCreate$1$1$1$1$1$1.this$0 │ ~~~~~~ ╰→ com.eynnzerr.avplayer.MainActivity instance Leaking: YES (ObjectWatcher was watching this because com.eynnzerr.avplayer.MainActivity received Activity#onDestroy() callback and Activity#mDestroyed is true) Retaining 108.1 kB in 2568 objects key = 427e7b26-a712-4eee-81f2-3040f34111a8 watchDurationMillis = 125452 retainedDurationMillis = 120450 mApplication instance of android.app.Application mBase instance of android.app.ContextImpl ==================================== 0 LIBRARY LEAKS A Library Leak is a leak caused by a known bug in 3rd party code that you do not have control over. See https://square.github.io/leakcanary/fundamentals-how-leakcanary-works/#4-categorizing-leaks ==================================== 0 UNREACHABLE OBJECTS An unreachable object is still in memory but LeakCanary could not find a strong reference path from GC roots. ==================================== METADATA Please include this in bug reports and Stack Overflow questions. Build.VERSION.SDK_INT: 30 Build.MANUFACTURER: unknown LeakCanary version: 2.9.1 App process name: com.eynnzerr.avplayer Class count: 19677 Instance count: 104943 Primitive array count: 86281 Object array count: 17593 Thread count: 20 Heap total bytes: 16092598 Bitmap count: 0 Bitmap total bytes: 0 Large bitmap count: 0 Large bitmap total bytes: 0 Stats: LruCache[maxSize=3000,hits=35774,misses=78728,hitRate=31%] RandomAccess[bytes=3855083,reads=78728,travel=23243159115,range=18698859,size=24675970] Heap dump reason: user request Analysis duration: 3073 ms Heap dump file path: /storage/emulated/0/Download/leakcanary-com.eynnzerr.avplayer/2022-10-27_22-39-44_274.hprof Heap dump timestamp: 1666881589949 Heap dump duration: 1291 ms
根据以上日志输出分析,以线程对象Thread object作为 GC Root,中间途径一系列协程内部的引用链,到达continuation对象,由continuation又能达到一个限定名为com.eynnzerr.avplayer.MainActivity$onCreate$1$1$1$1$1$1的奇怪对象,根据日志信息可以判定这个对象实际上是该协程的SuspendLambda匿名内部类对象,它封装了函数体内的代码块,也即间接代表着handler实例,因此便能最终到达MainActivity的实例,与理论相符。
原理分析 下面我们结合 LeakCanary2 的源码,对其运行原理进行分析。
非侵入式注册 首先,如果我们在项目中用过 LeakCanary1,不难会发现 LeakCanary2 相对于 1.x 版本一大变化在于,曾经我们需要在项目中重写Application并在其onCreate()方法中手动装载LeakCanary的监视器RefWatcher,为其传入context对象以完成其初始化:
1
2
3
... refWatcher = LeakCanary.install(this ); ...
但在 LeakCanary2 中,我们不再需要向项目中新增任何代码,只需要引入依赖即可。这是怎么实现的呢?实际上,这里用到了四大组件中ContentProvider的特性:在ContentProvider的生命周期中,它是在Application.attach()之后和Application.create()之前调用ContentProvider.onCreate()初始化,也即不需要我们手动进行显式初始化,并且此时也能获取到context,故可以通过一个ContentProvider实现非侵入式的注册,不会向现有项目引入任何注册相关的代码。所以在阅读源码时,也就不难理解为什么这里会继承ContentProvider。并且因为我们只是利用了contentProvider不仅能自动创建,还能在创建时拿到context的特性实现非侵入式注册,故对contentProvider的增删改查函数自然也没有实现(= null)
1
2
3
4
5
6
7
8
9
10
11
12
13
14
15
16
17
18
19
20
21
22
23
24
25
26
27
internal class MainProcessAppWatcherInstaller : ContentProvider () { override fun onCreate () Boolean { val application = context!!.applicationContext as Application AppWatcher.manualInstall(application) return true } override fun query ( uri: Uri , projectionArg: Array <String >?, selection: String ?, selectionArgs: Array <String >?, sortOrder: String ? ) null override fun getType (uri: Uri ) null override fun insert (uri: Uri , contentValues: ContentValues ?) null override fun delete (uri: Uri , selection: String ?, selectionArgs: Array <out String >?) Int = 0 override fun update ( uri: Uri , values: ContentValues ?, selection: String ?, selectionArgs: Array <out String >? ) Int = 0 }
MainProcessAppWatcherInstaller将在项目构建后在Manifest中声明。
1 2 3 4 5 6 7 <application > <provider android:name ="leakcanary.internal.MainProcessAppWatcherInstaller" android:authorities ="${applicationId}.leakcanary-installer" android:enabled ="@bool/leak_canary_watcher_auto_install" android:exported ="false" /> </application >
注意到这里将获取的context传入了AppWatcher.manualInstall()这个函数:
1
2
3
4
5
6
7
8
9
10
11
12
13
14
15
16
17
18
19
20
21
22
23
24
25
26
27
28
29
30
31
32
33
34
35
36
37
38
@JvmOverloads fun manualInstall ( application: Application , retainedDelayMillis: Long = TimeUnit.SECONDS.toMillis(5 ) watchersToInstall: List<InstallableWatcher> = appDefaultWatchers(application) ) { checkMainThread() if (isInstalled) { throw IllegalStateException( "AppWatcher already installed, see exception cause for prior install call" , installCause ) } check(retainedDelayMillis >= 0 ) { "retainedDelayMillis $retainedDelayMillis must be at least 0 ms" } this .retainedDelayMillis = retainedDelayMillis if (application.isDebuggableBuild) { LogcatSharkLog.install() } LeakCanaryDelegate.loadLeakCanary(application) watchersToInstall.forEach { it.install() } installCause = RuntimeException("manualInstall() first called here" ) }
注意到此处watchersToInstall有默认值appDefaultWatchers(application),实际上就是 LeakCanary 默认注册的一些预先定义的监视器:
1
2
3
4
5
6
7
8
9
10
11
fun appDefaultWatchers ( application: Application , reachabilityWatcher: ReachabilityWatcher = objectWatcher ) return listOf( ActivityWatcher(application, reachabilityWatcher), FragmentAndViewModelWatcher(application, reachabilityWatcher), RootViewWatcher(reachabilityWatcher), ServiceWatcher(reachabilityWatcher) ) }
这里也就解释了为什么 LeakCanary2 宣称可以自动检测Activity、FragmentAndViewModel、RootView和Service的内存泄漏。
捕捉内存泄漏 接下来我们继续看具体实现原理,以ActivityWatcher为例:
1 2 3 4 5 6 7 8 9 10 11 12 13 14 15 16 17 18 19 20 21 22 23 24 25 26 class ActivityWatcher ( private val application: Application, private val reachabilityWatcher: ReachabilityWatcher ) : InstallableWatcher { private val lifecycleCallbacks = object : Application.ActivityLifecycleCallbacks by noOpDelegate() { override fun onActivityDestroyed (activity: Activity ) reachabilityWatcher.expectWeaklyReachable( activity, "${activity::class.java.name} received Activity#onDestroy() callback" ) } } override fun install () application.registerActivityLifecycleCallbacks(lifecycleCallbacks) } override fun uninstall () application.unregisterActivityLifecycleCallbacks(lifecycleCallbacks) } }
这段代码有趣的地方有很多,我们首先把注意力聚焦在lifecycleCallbacks字段上。注意到这是一个实现了Application.ActivityLifecycleCallbacks接口的对象,并且委托给了noOpDelegate。乍看这个接口要求实现Activity生命周期中各个阶段的回调,但是这里只重写了onActivityDestroyed()方法。之所以能这么做是因为我们把其它回调函数的实现委托给了noOpDelegate,而为什么要这么做在于后续我们只会用到onActivityDestroyed()这一个回调,以此防止重写其它回调方法,实现更安全的封装。
接着我们注意到,在回调的内部调用了reachabilityWatcher.expectWeaklyReachable()函数。这个函数名很有意思,我们首先解释一下何谓weaklyReachable,即弱可达,其意为当前实例在引用链中仅可通过弱引用到达 。也就是说, leakCanary 在其内存泄漏检测中使用到了弱引用。实际上,这里就运用到了我们之前提到的特性:当一个实例弱可达时,其将会在下次 gc 中被回收;且如果在构建WeakReference时,传入一个ReferenceQueue,则当弱引用持有的对象被回收时, jvm 会将这个弱引用放入构造时关联的引用队列中。不用强引用,显然是因为强引用始终不会被回收;不用软引用,是因为软引用只会在OOM前被回收,不便于控制;不用虚引用,是因为虚引用与 gc 无关,不能起作用。
1
2
3
4
5
6
7
8
9
10
11
12
13
14
15
16
import java.lang.ref.ReferenceQueueimport java.lang.ref.WeakReferencefun main () val rq = ReferenceQueue<Pair<String, Int >?>() val weakReference = WeakReference(pair, rq) println(rq.poll()) pair = null System.gc() Thread.sleep(1000 ) println(rq.poll()) }
以上测试代码输出如下:
1
2
null java.lang.ref.WeakReference@2a84aee7
利用这个特性,我们便有可能感知到一个对象是否内存泄漏了,大致思路如下:以 Activity 为例, 监听 Activity 的回调,当 Activity 调用onDestroy()时,将其通过弱引用保存到一个ReferenceQueue中,在每次 gc 后等待一段时间,检查ReferenceQueue是否有值。正常情况下, Activity 在 destroy 后,生命周期走到尽头,理应被 gc 回收。此时除了我们添加的弱引用外不会再被引用,即此后 Activity 将处于弱可达状态。那么按照弱引用的特性,其将会在 gc 后被放入引用队列,即referenceQueue.poll()将返回弱引用值。但如果发生了内存泄露,即此时除了我们添加的弱引用外,Activity 还有别的强引用,那么 gc 时就不会回收该 Activity,即referenceQueue.poll()将一直返回null。据此,就能得知 Activity 是否发生了内存泄漏!
回到源码,我们说到在ActivityWatcher中设置了onActivityDestroyed的回调函数,并在其中调用了reachabilityWatcher.expectWeaklyReachable()函数。首先,这里的reachabilityWatcher是通过默认值传入的objectWatcher:
1 2 3 4 5 6 7 8 9 10 11 12 13 14 15 16 17 18 19 20 21 22 val objectWatcher = ObjectWatcher( clock = { SystemClock.uptimeMillis() }, checkRetainedExecutor = { check(isInstalled) { "AppWatcher not installed" } mainHandler.postDelayed(it, retainedDelayMillis) }, isEnabled = { true } ) ... fun appDefaultWatchers ( application: Application , reachabilityWatcher: ReachabilityWatcher = objectWatcher ) return listOf( ActivityWatcher(application, reachabilityWatcher), ... ) }
1 2 3 4 5 6 7 8 9 10 11 12 13 14 15 16 17 18 19 20 21 22 23 24 25 26 27 28 29 30 31 32 33 34 35 36 37 38 39 40 41 42 43 44 45 46 47 48 49 50 51 52 53 54 55 56 57 58 59 60 class ObjectWatcher constructor ( private val clock: Clock, private val checkRetainedExecutor: Executor, private val isEnabled: () -> Boolean = { true } ) : ReachabilityWatcher { private val watchedObjects = mutableMapOf<String, KeyedWeakReference>() private val queue = ReferenceQueue<Any>() ... @Synchronized override fun expectWeaklyReachable ( watchedObject: Any , description: String ) if (!isEnabled()) { return } removeWeaklyReachableObjects() val key = UUID.randomUUID() .toString() val watchUptimeMillis = clock.uptimeMillis() val reference = KeyedWeakReference( watchedObject, key, description, watchUptimeMillis, queue ) watchedObjects[key] = reference checkRetainedExecutor.execute { moveToRetained(key) } } ... private fun removeWeaklyReachableObjects () var ref: KeyedWeakReference? do { ref = queue.poll() as KeyedWeakReference? if (ref != null ) { watchedObjects.remove(ref.key) } } while (ref != null ) } ... @Synchronized private fun moveToRetained (key: String ) removeWeaklyReachableObjects() val retainedRef = watchedObjects[key] if (retainedRef != null ) { retainedRef.retainedUptimeMillis = clock.uptimeMillis() onObjectRetainedListeners.forEach { it.onObjectRetained() } } } }
经moveToRetained()中最后调用的回调,将调用HeapDumpTrigger.checkRetainedInstances()函数,进行 dump hprof 前的最后检查:
1 2 3 4 5 6 7 8 9 10 11 12 13 14 15 16 17 18 19 20 21 22 23 24 25 26 27 28 29 30 31 32 33 34 35 36 37 38 39 private fun checkRetainedObjects () ... var retainedReferenceCount = objectWatcher.retainedObjectCount if (retainedReferenceCount > 0 ) { gcTrigger.runGc() retainedReferenceCount = objectWatcher.retainedObjectCount } if (checkRetainedCount(retainedReferenceCount, config.retainedVisibleThreshold)) return val now = SystemClock.uptimeMillis() val elapsedSinceLastDumpMillis = now - lastHeapDumpUptimeMillis if (elapsedSinceLastDumpMillis < WAIT_BETWEEN_HEAP_DUMPS_MILLIS) { onRetainInstanceListener.onEvent(DumpHappenedRecently) showRetainedCountNotification( objectCount = retainedReferenceCount, contentText = application.getString(R.string.leak_canary_notification_retained_dump_wait) ) scheduleRetainedObjectCheck( delayMillis = WAIT_BETWEEN_HEAP_DUMPS_MILLIS - elapsedSinceLastDumpMillis ) return } dismissRetainedCountNotification() val visibility = if (applicationVisible) "visible" else "not visible" dumpHeap( retainedReferenceCount = retainedReferenceCount, retry = true , reason = "$retainedReferenceCount retained objects, app is $visibility " ) }
调用dumpHeap导出并分析 hprof 文件:
1
2
3
4
5
6
7
8
9
10
11
12
13
14
15
16
17
18
19
20
21
22
23
24
25
26
27
28
29
30
31
32
33
34
35
36
37
38
39
40
41
42
43
44
45
46
47
48
49
50
51
52
53
54
55
56
57
private fun dumpHeap ( retainedReferenceCount: Int , retry: Boolean , reason: String ) val directoryProvider = InternalLeakCanary.createLeakDirectoryProvider(InternalLeakCanary.application) val heapDumpFile = directoryProvider.newHeapDumpFile() val durationMillis: Long if (currentEventUniqueId == null ) { currentEventUniqueId = UUID.randomUUID().toString() } try { InternalLeakCanary.sendEvent(DumpingHeap(currentEventUniqueId!!)) if (heapDumpFile == null ) { throw RuntimeException("Could not create heap dump file" ) } saveResourceIdNamesToMemory() val heapDumpUptimeMillis = SystemClock.uptimeMillis() KeyedWeakReference.heapDumpUptimeMillis = heapDumpUptimeMillis durationMillis = measureDurationMillis { configProvider().heapDumper.dumpHeap(heapDumpFile) } if (heapDumpFile.length() == 0L ) { throw RuntimeException("Dumped heap file is 0 byte length" ) } lastDisplayedRetainedObjectCount = 0 lastHeapDumpUptimeMillis = SystemClock.uptimeMillis() objectWatcher.clearObjectsWatchedBefore(heapDumpUptimeMillis) currentEventUniqueId = UUID.randomUUID().toString() InternalLeakCanary.sendEvent(HeapDump(currentEventUniqueId!!, heapDumpFile, durationMillis, reason)) } catch (throwable: Throwable) { InternalLeakCanary.sendEvent(HeapDumpFailed(currentEventUniqueId!!, throwable, retry)) if (retry) { scheduleRetainedObjectCheck( delayMillis = WAIT_AFTER_DUMP_FAILED_MILLIS ) } showRetainedCountNotification( objectCount = retainedReferenceCount, contentText = application.getString( R.string.leak_canary_notification_retained_dump_failed ) ) return } }
以上代码执行了两个最为关键的逻辑:导出 hprof 和分析 hprof。
首先看 hprof 的导出操作:
1 2 3 4 durationMillis = measureDurationMillis { configProvider().heapDumper.dumpHeap(heapDumpFile) }
这里通过configProvider()拿到了同一个包下的LeakCanary.Config内部类实例,并调用其heapDumper.dumpHeap()函数:
1 2 val heapDumper: HeapDumper = AndroidDebugHeapDumper,
1 2 3 4 5 6 object AndroidDebugHeapDumper : HeapDumper { override fun dumpHeap (heapDumpFile: File ) Debug.dumpHprofData(heapDumpFile.absolutePath) } }
到这里就明确了: leakCanary 导出 hprof 的方式实际上就是调用 Android 系统给我们提供的接口:Debug.dumpHprofData(path : String)。
再看 hprof 的分析操作:
1 2 3 4 5 6 7 8 9 InternalLeakCanary.sendEvent( HeapDump( currentEventUniqueId!!, heapDumpFile, durationMillis, reason ) )
LeakCanary 实现了一套自己的简要的消息机制,Event是其预先定义的一些事件,EventListener是其监听到Event时的回调接口:
1 2 3 4 5 6 7 8 9 10 11 12 13 14 15 16 17 18 19 20 21 22 23 24 25 26 27 28 29 30 31 32 33 34 35 fun interface EventListener { sealed class Event ( val uniqueId: String ) : Serializable { class DumpingHeap (uniqueId: String) : Event(uniqueId) class HeapDump ( uniqueId: String, val file: File, val durationMillis: Long , val reason: String ) : Event(uniqueId) class HeapDumpFailed ( uniqueId: String, val exception: Throwable, val willRetryLater: Boolean ) : Event(uniqueId) class HeapAnalysisProgress ( uniqueId: String, val step: Step, val progressPercent: Double ) : Event(uniqueId) ... } fun onEvent (event: Event ) }
再看InteralLeakCanary.sendEvent()这个函数:
1 2 3 4 5 6 fun sendEvent (event: Event ) for (listener in LeakCanary.config.eventListeners) { listener.onEvent(event) } }
其实就是逐个调用每个EventListener的onEvent()函数罢了。再看LeakCanary.config.eventListeners中都注册了哪些监听器:
1 2 3 4 5 6 7 8 9 10 11 12 13 14 15 val eventListeners: List<EventListener> = listOf( LogcatEventListener, ToastEventListener, LazyForwardingEventListener { if (InternalLeakCanary.formFactor == TV) TvEventListener else NotificationEventListener }, when { RemoteWorkManagerHeapAnalyzer.remoteLeakCanaryServiceInClasspath -> RemoteWorkManagerHeapAnalyzer WorkManagerHeapAnalyzer.validWorkManagerInClasspath -> WorkManagerHeapAnalyzer else -> BackgroundThreadHeapAnalyzer } ),
与堆分析有关的是最后一个listener,这里根据情况分为了更细化的三种 Analyzer ,但它们都实现了EventListener接口,分别对应堆分析的三种运行场所,可由开发者自主选择(此处略过):
位于另一进程的workManager中
位于本进程的workManager中
位于本进程的一个后台线程中WorkManagerHeapAnalyzer为例,分析接下来的流程。
1 2 3 4 5 6 7 8 9 10 11 12 13 14 15 16 17 18 19 20 21 22 23 24 25 26 27 28 29 30 31 32 33 34 35 object WorkManagerHeapAnalyzer : EventListener { internal val validWorkManagerInClasspath by lazy { try { Class.forName("androidx.work.WorkManager" ) val dataBuilderClass = Class.forName("androidx.work.Data\$Builder" ) dataBuilderClass.declaredMethods.any { it.name == "putByteArray" }.apply { if (!this ) { SharkLog.d { "Could not find androidx.work.Data\$Builder.putByteArray, WorkManager should be at least 2.1.0." } } } } catch (ignored: Throwable) { false } } ... override fun onEvent (event: Event ) if (event is HeapDump) { val heapAnalysisRequest = OneTimeWorkRequest.Builder(HeapAnalyzerWorker::class .java).apply { setInputData(event.asWorkerInputData()) addExpeditedFlag() }.build() SharkLog.d { "Enqueuing heap analysis for ${event.file} on WorkManager remote worker" } val application = InternalLeakCanary.application WorkManager.getInstance(application).enqueue(heapAnalysisRequest) } } }
可以看到我们通过反射加载WorkManager类。之后在onEvent()中就是常规的workManager的用法了:构建Worker,传入workManager执行。
1 2 3 4 5 6 7 8 9 10 11 12 13 14 15 internal class HeapAnalyzerWorker (appContext: Context, workerParams: WorkerParameters) : Worker(appContext, workerParams) { override fun doWork () val doneEvent = AndroidDebugHeapAnalyzer.runAnalysisBlocking(inputData.asEvent()) { event -> InternalLeakCanary.sendEvent(event) } InternalLeakCanary.sendEvent(doneEvent) return Result.success() } ... }
1 2 3 4 5 6 7 8 9 10 11 12 13 14 15 16 17 18 19 20 21 22 23 24 fun runAnalysisBlocking ( heapDumped: HeapDump , isCanceled: () -> Boolean = { false }, progressEventListener: (HeapAnalysisProgress ) -> Unit ) val progressListener = OnAnalysisProgressListener { step -> val percent = (step.ordinal * 1.0 ) / OnAnalysisProgressListener.Step.values().size progressEventListener(HeapAnalysisProgress(heapDumped.uniqueId, step, percent)) } val heapDumpFile = heapDumped.file val heapDumpDurationMillis = heapDumped.durationMillis val heapDumpReason = heapDumped.reason val heapAnalysis = if (heapDumpFile.exists()) { analyzeHeap(heapDumpFile, progressListener, isCanceled) } else { missingFileFailure(heapDumpFile) } ...省略一大段代码 }
其实到这一步,代码的执行重点就转到调用Shark提供的堆分析工具了。Shark同样出自 Square 之手,在 LeakCanary2 中用以代替之前版本中使用的堆分析工具HAHA。结合注释看Shark的用法:
1
2
3
4
5
6
7
8
9
10
11
12
13
14
15
16
17
18
19
20
21
22
23
24
25
26
27
28
29
30
31
32
33
34
35
36
37
38
39
40
41
42
43
44
45
46
47
48
49
50
51
52
53
54
55
56
57
58
59
60
private fun analyzeHeap ( heapDumpFile: File , progressListener: OnAnalysisProgressListener , isCanceled: () -> Boolean ) val config = LeakCanary.config val heapAnalyzer = HeapAnalyzer(progressListener) val proguardMappingReader = try { ProguardMappingReader(application.assets.open (PROGUARD_MAPPING_FILE_NAME)) } catch (e: IOException) { null } progressListener.onAnalysisProgress(PARSING_HEAP_DUMP) val sourceProvider = ConstantMemoryMetricsDualSourceProvider(ThrowingCancelableFileSourceProvider(heapDumpFile) { if (isCanceled()) { throw RuntimeException("Analysis canceled" ) } }) val closeableGraph = try { sourceProvider.openHeapGraph(proguardMapping = proguardMappingReader?.readProguardMapping()) } catch (throwable: Throwable) { return HeapAnalysisFailure( heapDumpFile = heapDumpFile, createdAtTimeMillis = System.currentTimeMillis(), analysisDurationMillis = 0 , exception = HeapAnalysisException(throwable) ) } return closeableGraph .use { graph -> val result = heapAnalyzer.analyze( heapDumpFile = heapDumpFile, graph = graph, leakingObjectFinder = config.leakingObjectFinder, referenceMatchers = config.referenceMatchers, computeRetainedHeapSize = config.computeRetainedHeapSize, objectInspectors = config.objectInspectors, metadataExtractor = config.metadataExtractor ) if (result is HeapAnalysisSuccess) { val lruCacheStats = (graph as HprofHeapGraph).lruCacheStats() val randomAccessStats = "RandomAccess[" + "bytes=${sourceProvider.randomAccessByteReads} ," + "reads=${sourceProvider.randomAccessReadCount} ," + "travel=${sourceProvider.randomAccessByteTravel} ," + "range=${sourceProvider.byteTravelRange} ," + "size=${heapDumpFile.length()} " + "]" val stats = "$lruCacheStats $randomAccessStats " result.copy(metadata = result.metadata + ("Stats" to stats)) } else result } }
定位泄漏对象 ClosableHeapGraph就是实现了closable接口的HeapGraph子接口,故我们分析HeapGraph的结构:
1
2
3
4
5
6
7
8
9
10
11
12
13
14
15
16
17
18
19
20
21
22
23
24
25
26
27
28
29
30
31
32
33
34
35
36
37
38
39
40
41
42
43
44
45
46
47
48
49
interface HeapGraph { val identifierByteSize: Int val context: GraphContext val objectCount: Int val classCount: Int val instanceCount: Int val objectArrayCount: Int val primitiveArrayCount: Int val gcRoots: List<GcRoot> val objects: Sequence<HeapObject> val classes: Sequence<HeapClass> val instances: Sequence<HeapInstance> val objectArrays: Sequence<HeapObjectArray> val primitiveArrays: Sequence<HeapPrimitiveArray> @Throws(IllegalArgumentException::class) fun findObjectById (objectId: Long ) @Throws(IllegalArgumentException::class) fun findObjectByIndex (objectIndex: Int ) fun findObjectByIdOrNull (objectId: Long ) fun findClassByName (className: String ) fun objectExists (objectId: Long ) Boolean fun findHeapDumpIndex (objectId: Long ) Int fun findObjectByHeapDumpIndex (heapDumpIndex: Int ) }
可以看到HeapGraph可以解析出该堆快照的信息,包括各种对象,并提供索引方法访问。那么,我们便有方法探测堆中发生内存泄漏的对象的位置了:
首先根据上文分析,可知此时目标对象被com.squareup.leakcanary.KeyedWeakReference所持有,故可以用findClassByName()方法传入全限定名找到这个类;
解析这个类的实例域,找到字段名和引用对象的ID,再用findObjectById()方法就能定位到目标对象了。
Shark 在解析得到heapGraph的背后封装了大量逻辑,使得堆分析十分简便易用。是个好库,感恩 Square!
确定泄漏引用链 在之前 LeakCanary2 的简单使用示例中,我们可以看到最终在 app 里显示了从 GC Roots 对象到内存泄漏对象的引用链,这一步便是确定这条引用链。由于到内存泄漏对象可能存在多条引用链,故Shark选择 BFS 找出最短引用链。
1
2
3
4
5
6
7
8
9
10
11
12
13
14
15
16
17
18
19
20
21
22
23
24
25
26
27
28
29
30
31
32
33
34
35
36
37
38
39
40
41
private fun State.findPathsFromGcRoots () enqueueGcRoots() val shortestPathsToLeakingObjects = mutableListOf<ReferencePathNode>() visitingQueue@ while (queuesNotEmpty) { val node = poll() if (leakingObjectIds.contains(node.objectId)) { shortestPathsToLeakingObjects.add(node) if (shortestPathsToLeakingObjects.size == leakingObjectIds.size()) { if (computeRetainedHeapSize) { listener.onAnalysisProgress(FINDING_DOMINATORS) } else { break @visitingQueue } } } val heapObject = graph.findObjectById(node.objectId) objectReferenceReader.read(heapObject).forEach { reference -> val newNode = ChildNode( objectId = reference.valueObjectId, parent = node, lazyDetailsResolver = reference.lazyDetailsResolver ) enqueue(newNode, isLowPriority = reference.isLowPriority) } } return PathFindingResults( shortestPathsToLeakingObjects, if (visitTracker is Dominated) visitTracker.dominatorTree else null ) }
至此, LeakCanary 检测内存泄漏的主要流程便走完了。我们了解了从 app 启动开始,contentProvider注册监视器,到检测到内存泄漏,触发回调,产生 hprof 文件,解析堆结构,到计算引用链为止 leakCanary 的工作原理,再后续的工作只剩下 UI 层的显示,以及和 LeakCanary app 的 IPC 通信,不再属于我们今天讲解的重点,便不再赘述,有兴趣的同学可以自己下载 LeakCanary2 源码 学习。
总结
利用弱引用和引用队列的特性捕获内存泄漏;
利用WorkManager(动态获取)执行后台任务;
利用Shark解析堆快照文件;
利用广度优先搜索确定引用链。